 Unit 4 - Activity 2 Maps as Design Tools
Activity Overview
In this activity, students will learn to use maps as design tools to constrain their thinking for authoring design requirements, which can eventually be implemented using programming.
Key Terms and Concepts
Key Takeaways:
Driving Questions:
Materials and Preparation:
MATERIALS
- Projector
- Computer
- Alternatively: Instructors can prepare printed-out example maps and hand them out to students
PREPARATION
Instructors should identify several map design examples which visualize or present non-path/location information in a creative way to demonstrate how maps can be used as tools for computational thinking.
Example Map Design Screenshots:
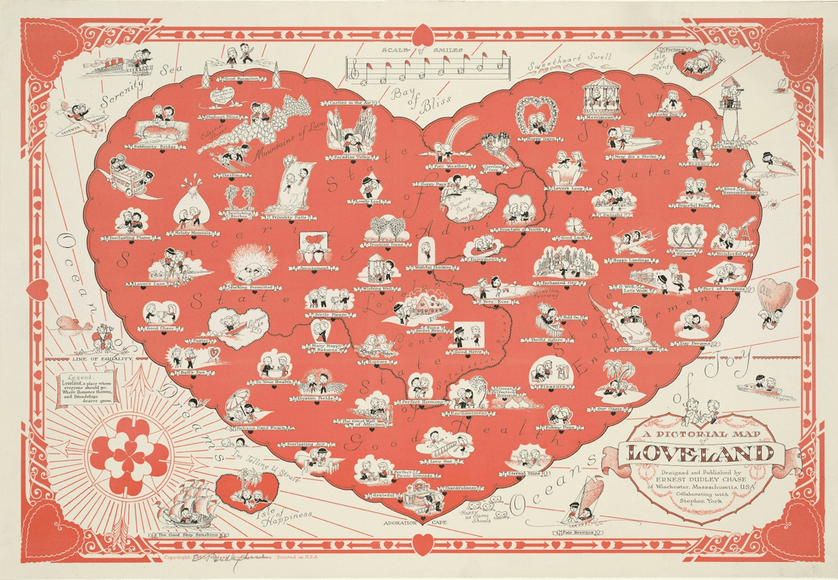
IMAGE CREDIT: POSTED ON STREETSOFSALEM.COM/2012/02/14/MAPS-OF-THE-HUMAN-HEART
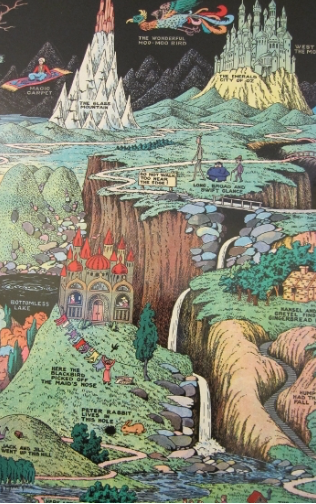
IMAGE CREDIT: © KATHERINE SAXON
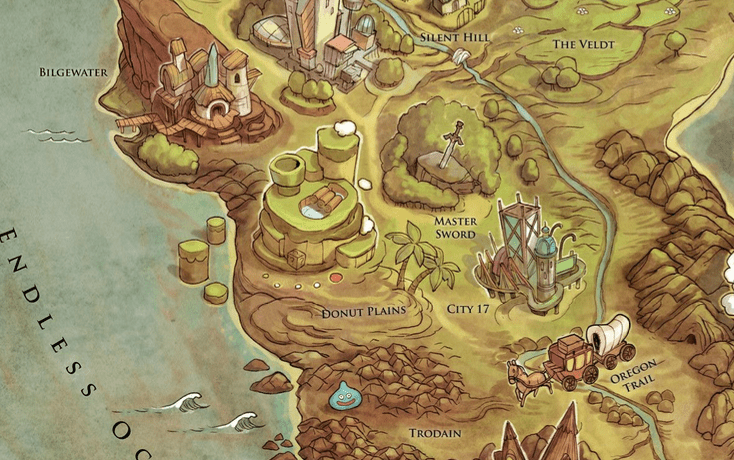
IMAGE CREDIT: © EDISON YAN
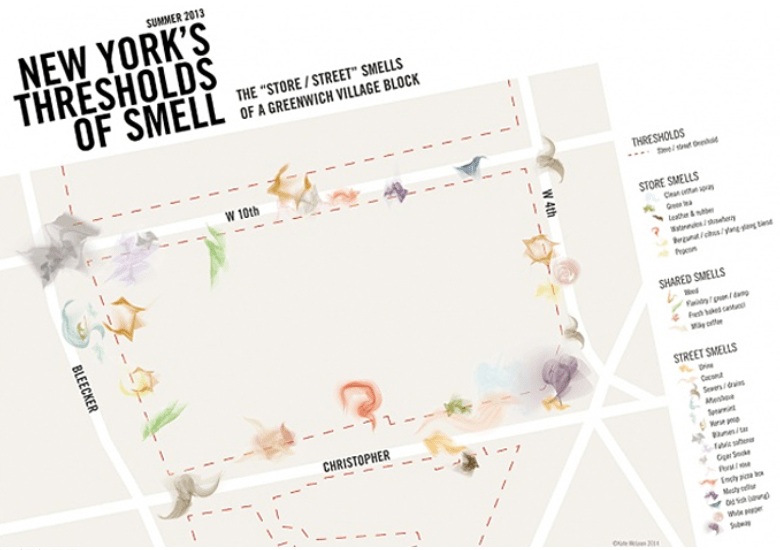
IMAGE CREDIT: © SENSORY MAPS / © KATE MCLEAN
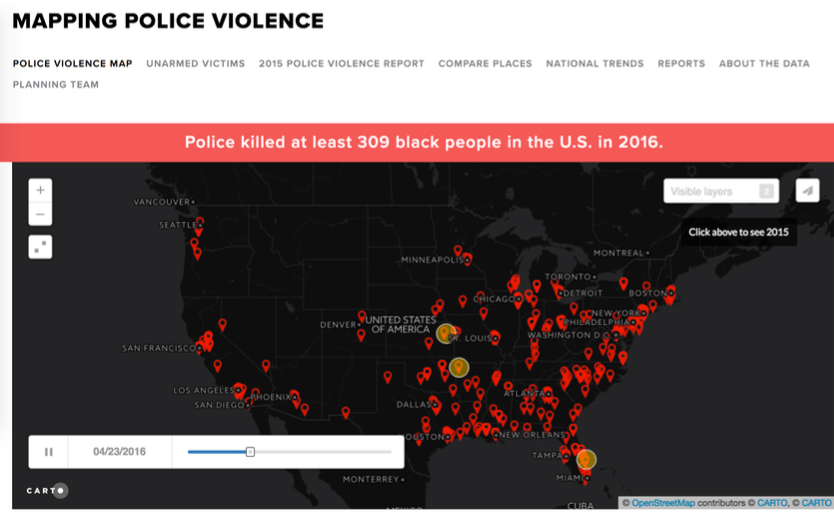
IMAGE CREDIT: MAPPINGPOLICEVIOLENCE.ORG
Activity Instructions
- Maps as Design tools (15 minutes)
- Present Mazzy/map game example visuals as starting point
- Next, continue to other map visuals which present other themes/data in creative ways
- Identify and label the themes and ideas in the map
- Discuss what information is being presented and how it’s being presented
- Critique how the map is effective (or not) at conveying themes
- After going through examples, discuss common “requirements” that all the map designs needed to address to be created
- How did the designers go from the information/idea to the visual map?
- Students Brainstorm Map Themes (20 minutes)
- Based on the previous discussion, students will use the sticky note method to elicit themes for their own, new map designs:
- Distribute sticky notes and markers to students
- Have students silently write ideas and post their notes on the wall
- Instructors may either go over the notes aloud as a group or review/organize the notes after class, coming up with labels to cluster similar ideas into “themes.”
- These themes will be used in the next unit to design and prototype map games.